A standardized method with clearly defined good-bad-criteria is not available for testing solder joints that connect single cells into strings. Thus, a comparative characterization of different manufacturers, cell types, base- and joining materials or joining technologies is impossible. The most commonly used test for solar cell ribbon interconnects is the pull test, as used in micro-electronics. For thin, brittle, large area silicon solar cells substantial modifications of the test equipment and methodology are required to realize a suitable metrology. In addition the factors influencing the defect conditions in multi crystalline material, high strains around the solder connect and inhomogeneous contact interfaces has to be considered.
New test method
Requirements to the test method:
- reproducible (stabile test conditions, no silicon tears, …)
- comparable (manufacturer, cell types, base- and joining materials, joining technology, …)
- easy to handle (less handle steps, semi-automatic, little operator influences)
- high throughput (little setting-up time, high test speed)
- simply analyzable (statistics, visualization of test values and failure interface)
- possible correlation to micro structure of solder joints
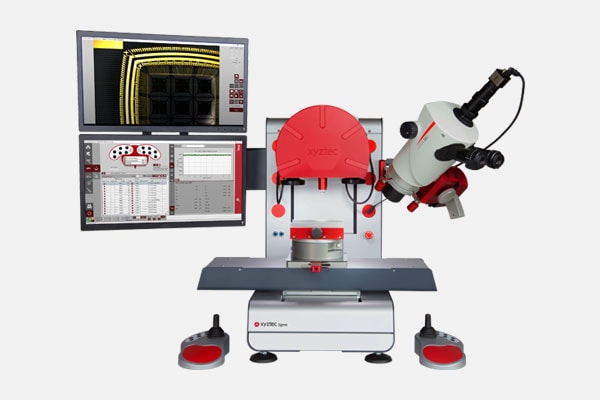
Condor 250
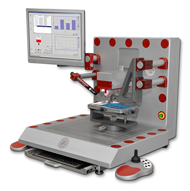
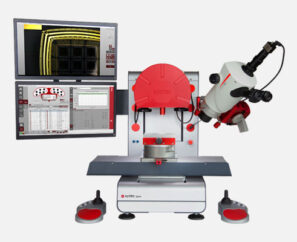
A xyztec Condor 250 multifunctional test machine was upgraded with a new designed test setup. The machine includes a vertical moving z-axis equipped with a force sensor and a x-y-stage for horizontal movement of the work holder. The X-Y table moves the cell at the same velocity than the z-axis pulls the solder ribbon. Thus the point of breakage remains under the measuring head and the test range equates to the ribbon length.

Results
The graphical analysis of the measurement results and the images of the fracture interface allow correlating the pull force values with the corresponding failure mode. Every single change in the fracture interface is reproducible in the progression of the curve. So it seems to be possible to conclude to the solder joint condition by interpreting the measured curve.
To correlate the pull test measurement curves and fracture interfaces with concrete interface weakening like voids, non-wetted areas or microcracks etcetera different non-destructive analyzes of soldered bus bar interconnects like scanning acoustic microscopy (SAM) or X-ray inspection with following validation by metallographic cross sections were performed before the pull test.

Summary
With the developed test equipment and measurement routine it is succeeded to provide a reproducible, fast and easy handable method which is usable independent from solar cell geometry, condition of contact materials, soldering technology or manufacturer. It is possible to correlate the measurement curve of the pull test with the fracture interface. This allows to interpret the results with statements in terms of the solder joint quality.
*Fraunhofer Institute for Mechanics of Materials IWM, Walter-Huelse-Strasse 1, 06120 Halle (Saale), Germany Phone +49 (0) 345/5589-159,
** Fraunhofer Center for Silicon Photovoltaics CSP, Walter-Huelse-Strasse 1, 06120 Halle (Saale), Germany
***xyztec b.v., J.F.Kennedylaan 14-B, 5981 XC Panningen, The Netherlands
Acknowledgement
This work was partly supported by the German Ministry of Economics and Technology under contract “ATSOLOT” (FKZ01FS10010).


